Methodology
National average annual savings by new customers surveyed who saved with Polly in Q2 2026. Actual savings may vary.
National average increase of buying power of $5,438 for new customers surveyed who saved with Polly in Q4 2025 across 72-month loan term at 7.5% APR for used cars and 4.8% APR for new. Actual amount may vary.
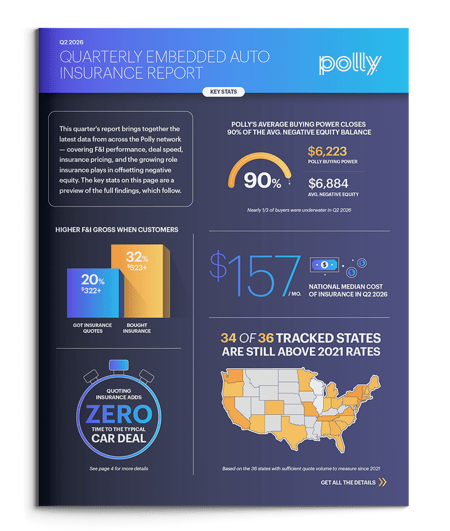
National average increase of buying power of $6,223 for new customers surveyed who saved with Polly in Q2 2026 across 72-month loan term at 7.7% APR for used cars and 4.66% APR for new. Actual amount may vary.
The dataset comprises of 1,285,740 vehicle retail sales transactions covering the period from January’22 to March’26, with an average 30 thousand transactions per month.
Time to close data comes from an Authenticom DMS feed, cleaned and filtered to personal retail transactions (fleet, wholesale, dealer-trade and business sales removed). The working dataset covers 661,846 retail sales at 216 dealerships from January 2023 through June 2026.
The sales transactions are as reported by 147 distinct dealership groups with between 1 and 42 stores, with the median group reporting more than 3,500 transactions over the 3 years period. As the dealership level variation is a main source of heterogeneity in the data, the data have been imputed using ARIMA models to create an additional synthetic 50,000 transactions to account for some dealerships not reporting in some months.
The dataset covers at least 10,000 transactions for each of 24 distinct vehicle brands, with the top 5 of FORD, TOYOTA, HONDA, KIA and CHEVROLET covering 42% of all sales.
Top 10 Dealerships are selected each quarter among the high-Polly-engagement dealerships, meaning at least 50 quotes and quoting at least 2% of car buyers each month.
Insurance rate data is based on 1.6 million insurance quotes over the past 14 quarters from 9 insurance carriers for car buyers in all 50 states.
Edmunds Negative Equity Q2 2026 Report
Edmunds Negative Equity Q4 2025 Report